

JavaScript diagramming library powering exceptional UIs
Prague, Czechia
- Tweets 439
- Following 106
- Followers 550
- Likes 48














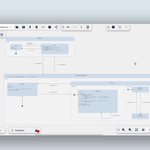

How long does it take to develop a workflow builder UI?
~6,616 hours without JointJS
~320 hours with JointJS (often much less, depending on configuration)
(Backed by our ROI analysis, linked below.)
Does it even make sense to build such a UI from scratch?
Short answer: No.
Longer answer: Yes, if you want to waste ~6,296 hours of development time.
Diagramming is trickier than it seems: 2D graphics, advanced interactions, geometry, automatic layout algorithms, performance…
Today, we’re giving you a brand new workflow builder UI — one that you can copy and customize to match your use case.
And ship a production-ready app in days.
Need different shapes? A vertical layout rather than horizontal? Another color palette? Different hover effects?
You can tweak it any way you want, while still saving months of expensive development time.
Explore the newest workflow builder 👉 jointjs.com/demos/workflow-b…
(Source code included in JointJS+ 4.2.2.)
1
6
4,414
Did you know? 👀
@Tricentis, a global leader in continuous testing and quality engineering, uses JointJS to power Tosca’s Business Flow Designer.
Teams can visually design end-to-end test flows that mirror real business scenarios, and execute them as automated, business-critical tests.
#CustomerShowcase #Tricentis #TestAutomation #Diagramming
1
4
84
Building a marketing automation UI from scratch? It’s a massive engineering lift.
We just released a production-ready app template to speed that up.
It includes an intuitive automation studio and pro diagramming features — taking you from zero to a functional flow builder in days.
Source code available in the latest JointJS+ (4.2.2).
Curious to see it in action? 👉 jointjs.com/demos/marketing-…
12
10,132
💥 JointJS 4.2 is here!
This release brings guided, layout-driven editing that makes creating diagrams smoother than ever — even for less technical users.
You’ll also find a new Layers API, major performance boosts for large graphs, and seven new boilerplate apps to jump-start development. 👌
👉 jointjs.com/blog/releasing-4…
Inside the full blog post, you’ll also find:
🤖 AI Agent Builder boilerplate — grab the source code and plug it into your product
⚡ Performance showcase: 19,999 elements rendered in 0.24 seconds
🟦 Demonstration of the new Layers API, unlocking new potential
🚀 BPMN Editor plus five additional boilerplate apps
There’s a lot packed into 4.2 — and even more on the way.
Next stop: JointJS for React. 🔥
3
95
Love JointJS as much as we do?
Now you can spread the word and earn up to $18,300 per commission with our brand-new affiliate program. 🚀
We’ve built the system to finally reward your recommendations: every deal you bring earns you 15% commission.
How it works:
1️⃣ Join our affiliate program
2️⃣ Share your unique referral link or ready-made assets
3️⃣ Get paid whenever your referral becomes a customer
Who’s it for?
✍️ Technical writers & educators
🎙️ YouTubers & podcasters
👍 Social media influencers
❤️ …or simply anyone who loves JointJS and wants to share it
Help us grow, and grow your income too. Join the program today 👉 jointjs.com/affiliate

2
117
Coming in the next JointJS release!👌
A Fishbone (Ishikawa) diagram builder – your go-to tool for breaking down problems and finding their root causes.
From bug tracking to product retrospectives, process improvement, or quality control — this diagram helps you or your users 👇
1/ Organize potential causes into clear categories (e.g. Material, Machine, Management, Environment).
2/ Spot patterns and dependencies that aren’t obvious at first glance.
3/ Collaborate with teams on fixing the actual problem, not just symptoms.
Whether you’re debugging a stubborn feature, running a sprint retro, or improving a production process — this visual structure keeps the conversation focused and productive.
Try our latest demo app 👉 jointjs.com/demos/fishbone
2
100
🌀 JointJS for React is here — alpha release of our open-source library!
No more wrappers. No more workarounds. Just a native React experience for building diagrams the way you want.
👨💻 Try it out:
npm install @joint/react
# or use yarn, pnpm, bun
We need your feedback to make it great:
• What would make using JointJS in React better?
• Is the documentation clear?
• Is anything missing or confusing in the API?
Dive into the details & share your thoughts:
bit.ly/4732tCS
Happy diagramming! ✨
3
101
Curious how @OpenAI and @AnthropicAI rose to prominence?
Did you know that @DarioAmodei, OpenAI’s former VP of Research, left to found @AnthropicAI — or that @amazon poured $4 billion into it in 2023?
Some facts may surprise you, others maybe not. But one thing’s clear: this JointJS-powered timeline lets you explore the key milestones of both companies — visually, of course. Wouldn't be us otherwise. 🙂
Play with the timeline yourself — explore their history, rearrange events, or even predict the future 👉 jointjs.com/demos/timeline
P. S. All the features used to build this interactive timeline are included in the upcoming JointJS+ release — but feel free to reach out if you need early access 🤫
2
87
🎉 Hohoooo! A big day for us — we just hit 5,000 GitHub stars!
We hear you: “C’mon, there are repos way bigger than that!”
True. But we celebrate every star, every person falling in love with our library, and every new diagrammer out there. ❤️
It’s been an amazing ride with all of you, and we truly appreciate your support. You’re the engine behind our motivation — and we’ve got some big plans ahead!
So stay tuned, give us a ⭐ if you haven’t already, and let’s diagram like never before.
🐈⬛ github.com/clientIO/joint

2
67
Stop shipping 2010-era BPMN editors.
We’ve just released a major update to our BPMN boilerplate app—designed to help you build a modern, fully interactive process editor with minimal setup.
It’s especially useful if you’re:
🌐 Migrating a BPMN app from desktop to web
⚙️ Adding a visual editor to an existing BPMN engine
🎨 Replacing a clunky UI with something cleaner and more intuitive
The boilerplate gives you a solid starting point—customizable, production-ready, and packed with advanced diagramming features.
👉 Check out the demo: bit.ly/3Gh2OHb
We’re actively iterating on it, so your feedback is very welcome!
1
2
143
💥 Boom. The most beautiful AI workflow app template is here.
We believe AI agents are at the core of how people will use web applications in the future. And we want you to be ready.
That’s why we created this boilerplate app — an asset that gets you from zero to one in just days.
✅ Advanced diagramming features included
✅ Full source code provided
✅ Fully customizable to fit your stack and use case
It’s written in vanilla TypeScript — but plays nicely with any framework: React, Angular, Vue, and Svelte.
If your roadmap includes an AI-powered workflow builder, explore this demo app that can save you months of in-house development 👉 bit.ly/4kawtQn
#AIAgent #AI #Diagramming
1
2
286
❌ Text boxes won’t cut it anymore.
In our latest article, our teammate Zbynek explores how AI is changing the way we design UIs — and why we need to move beyond simple chats and command inputs.
A few takeaways:
✅ Users expect collaboration, not just conversation
✅ Interfaces are becoming more visual and structured (think flowcharts, not forms)
✅ Designing for AI agents means rethinking how we present context, goals, and control
Whether you're building tools for automation, data, or decision-making — this shift is already underway.
(The article backs up these points with plenty of real-world examples from modern AI-powered tools.)
jointjs.com/blog/ai-interfac…
#AI #UserInterfaces
104
Just like HTML and JavaScript—one structures the content, the other brings it to life—JointJS and @bryntum work beautifully together. 💙
We combined them to build a new app with a synchronized #Gantt chart (Bryntum) and a #PERT chart (JointJS).
The result?
A dynamic, multi-view project planning experience. 🔝
Now, all the familiar views users love in tools like @clickup, @asana, or @mondaydotcom can live inside your own app.
Give it a spin 👉 jointjs.com/demos/bryntum-in…
1
2
143
Effective project management relies on clear visualization techniques. One such technique is the PERT chart, which you can explore in our latest demo. 🎉
Although this app is view-only, it showcases some amazing JointJS+ features:
✔️ Automatic layout that neatly organizes elements on the canvas
✔️ Custom shapes for more complex data visualizations
✔️ Zoom and pan functionality for easy navigation
Explore it for yourself 👉 jointjs.com/demos/pert-chart
(All the features needed to build this application are included in the upcoming JointJS+ release — stay tuned.)
78
Long time no demo, right?
To bring back the Demo Wednesday spirit, we’re dropping a brand-new one! 🔝
Need to create interactive wiring diagrams? Check out our Cables demo, built with JointJS+ and TypeScript.
It showcases custom elements like multi-wire cables, screw terminals, and plugs—highlighting how JointJS+ makes it easy to model complex systems with smooth drag-and-drop interactions.
Even better: the functionality behind this demo is coming in the next JointJS+ release. Stay tuned! 🔥
Ready to try it out? Dive in here 👉 jointjs.com/demos/cables
1
77
Curious about how visual programming is revolutionizing coding? 🌟
It’s breaking barriers, democratizing programming, and thriving in the AI era.
Explore its history, benefits, and real-world use cases 👇
jointjs.com/blog/visual-prog…
50
How can you combine and maximize the potential of diagramming and AI? How do you build an interactive application that leverages the latest AI models while offering users maximum flexibility through the power of diagramming?👇
#Diagramming #AI
bit.ly/3ZFPz8D
109
🎉 4.1 is here: The biggest release so far!
Packed with SO MANY NEW FEATURES—and ZERO breaking changes.
You asked, we listened. After spending six months in the dark coding, we’re finally bringing you this beauty! 🙌
jointjs.com/blog/introducing…
1
1
3
182
🤓 Have you checked out our new documentation yet?
It features:
1️⃣ Updated tutorials
2️⃣ Simplified navigation & Algolia-powered search
3️⃣ Improved design
👉 Take a look and let us know what you think: bit.ly/3LX4AMZ
151
16% of the global population have disabilities according to the World Health Organization. How can we build (diagramming) web apps to ensure they are accessible to everyone?
#accessibility #diagramming
bit.ly/3XY8ZpL
1
115