

JavaScript diagramming library powering exceptional UIs
Prague, Czechia
- Tweets 439
- Following 106
- Followers 550
- Likes 48
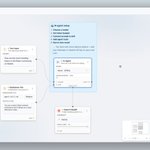


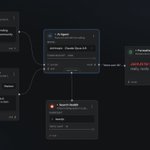









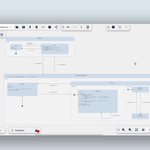

This week, we explored how enterprises can visualize relationships among business domains using the ArchiMate enterprise architecture modeling language (a standard of @TheOpenGroup ) 👇
#DemoWednesday
1
152
Enterprise Architects and all diagramming enthusiasts, today's demo will be especially useful for you 👉 jointjs.com/demos/the-archim…
#ArchiMate #ModelingLanguage #TheOpenGroup
2
111
Another week, another masterpiece! This time, our dev team has enhanced the BPMN Pools, Swimlanes, and Milestones, now fully leveraging the power of drag & drop 🔝
1
1
164
Here's a quick feature overview:
✅ Add and reorder swimlanes and phases using drag & drop
✅ Swimlanes and phases auto-adjust in size to fit content
✅ Clarification of drag & drop actions with preview displays
✅ Capability to move lanes between different pools
1
85
👀 See it in action: Check out our interactive BPMN Pools demo and experience the upgrade for yourself 👉 jointjs.com/demos/bpmn-pools…
#DemoWednesday #BPMN
91
🔝 New Demo: Image Processing Application that combines the best of JointJS+ and the open-source @opencvlibrary to help transform images in a node-based way.
jointjs.com/demos/image-proc…
2
3
165
As developers, we thrive on challenges and often think, "I can do it myself." But what about our stakeholders–customers and business leaders–who aim for quick solutions?
1
2
2
253
Join us in our latest article where we dive into the build vs. buy debate in diagramming. Uncover the complexity behind fundamental diagramming features such as rendering custom shapes, link routing, automatic layout and many more.
1
1
88
After reading this article, you should have a clear idea of whether you want to build your diagramming solution from the ground up–with clear expectations of what's to come–or opt for a ready-made solution. ✅
jointjs.com/blog/the-complex…
2
81
📣 New Demo: Inspector for Selection
Did you ever need to view and modify the data of multiple diagram elements at once? Thanks to the combined power of the Inspector and Selection plugins of JointJS+, you can!
1
113
Try it for yourself in today's demo ➡️ jointjs.com/demos/inspector-…
#DemoWednesday
65
📣 New Demo: SysML Parametric Diagram (PAR)
Curious about SysML diagrams, specifically the parametric diagram that is often used in systems engineering? Explore our latest demo 👉 bit.ly/46BoMg1
#DemoWednesday
2
109
📣 New Demo: Stencil Theme Picker
This week, we decided to make life easier for your customers again. Because they may not have the design skills to create visually appealing diagrams, their diagrams may end up looking messy or visually cluttered.
1
2
124
With JointJS+'s new pre-built feature, stencil theme picker, they can choose from a range of pre-defined and visually interesting element themes to make their diagrams more unified and visually pleasing.
1
2
90
Explore this great feature in our newest demo app 👉 jointjs.com/demos/stencil-th…
#DemoWednesday
2
58
📣 New Demo: Element Neighborhood Dialog Window
When working with a large number of objects, it is useful to activate a local view and drill down into the surroundings of a specific element 🔎
1
1
142
In today's demo, we show you multiple element relationships and local views: Neighbors, Successors, Predecessors, Siblings and Path from Element, all displayed as a floating popup that can be freely placed anywhere on the paper 👇
#DemoWednesday
1
105
📣 New Demo: Yamazumi 3D
For the past 40+ Wednesdays, we've always introduced a brand new demo. Today we took a step back and refreshed one of our favorite JointJS+ demos, Yamazumi 3D 📊
1
3
127
What is such an app good for, you ask? Yamazumi chart is mainly used in lean manufacturing and process analysis to visualize the balance of work between process steps. By stacking activities, it is easy to compare the work content of different steps and thus make improvements 👌
1
64
Interested in trying out the demo application yourself? Here you go 👉 jointjs.com/demos/yamazumi-3…
#DemoWednesday
56